Counting the Unemployed: The Messy Truth Behind the Jobs Report - Part 1
Written by Arbitrage • 2026-02-25 00:00:00
Every first Friday of the month, the Bureau of Labor Statistics drops the jobs report. Markets move. Headlines blare. Politicians scramble to spin it. It might be the most influential single number in the American economy. But here's what most people don't realize: that number is a rough estimate that will be revised multiple times, it excludes millions of people who can't find work, and the system producing it was designed for an economy that no longer exists. This post is a look at where employment data comes from, what it misses, and why the 2025 benchmark revision, the largest downward revision on record, should make all of us more thoughtful consumers of economic news.
How We Started Counting (And Why)
For most of American history, there was no reliable way to measure unemployment. The decennial census collected bits and pieces, but a snapshot every ten years isn't useful for understanding an economy in motion. That changed during the Great Depression. With unemployment surging past 25%, policymakers realized they were making massive spending decisions with almost no data. The political urgency to actually count the jobless became overwhelming.
By 1940, the Census Bureau launched what would become the Current Population Survey (CPS), the household survey that still underpins the unemployment rate today. Meanwhile, the BLS had been building its employer survey since the 1930s, boosted by the Social Security Act of 1935, which required businesses to report payroll data for the new unemployment insurance system. These two surveys - one asking households, one asking employers - became the twin pillars of the monthly jobs report. They were designed for a mid-century economy of factory jobs and single-employer careers. We're still using them today.
Two Surveys, Two Stories
One of the most underappreciated facts about the jobs report is that it's actually two separate surveys that often disagree. The Household Survey (CPS) interviews about 60,000 households each month. It produces the headline unemployment rate and captures self-employed workers, gig workers, and people in brand-new businesses. The Establishment Survey (CES) surveys roughly 121,000 businesses covering 631,000 worksites. It produces the payroll jobs number, the one that moves markets. Its much larger sample gives it a smaller margin of error for month-to-month changes.
These two surveys can tell very different stories in any given month. That's not a bug, they are measuring different things. But it means the "truth" about the labor market is always fuzzier than any single headline suggests.
The "Actively Seeking Work" Problem
Here's the most important thing to know about the unemployment rate: you're only counted as unemployed if you are actively looking for a job. Stop looking, even if it's because you've given up after months of rejection, and you disappear from the data entirely. This is a definitional choice, not an accident. But it means that during bad downturns, the headline rate can actually understate how many people are struggling, because discouraged workers drop out of the denominator.
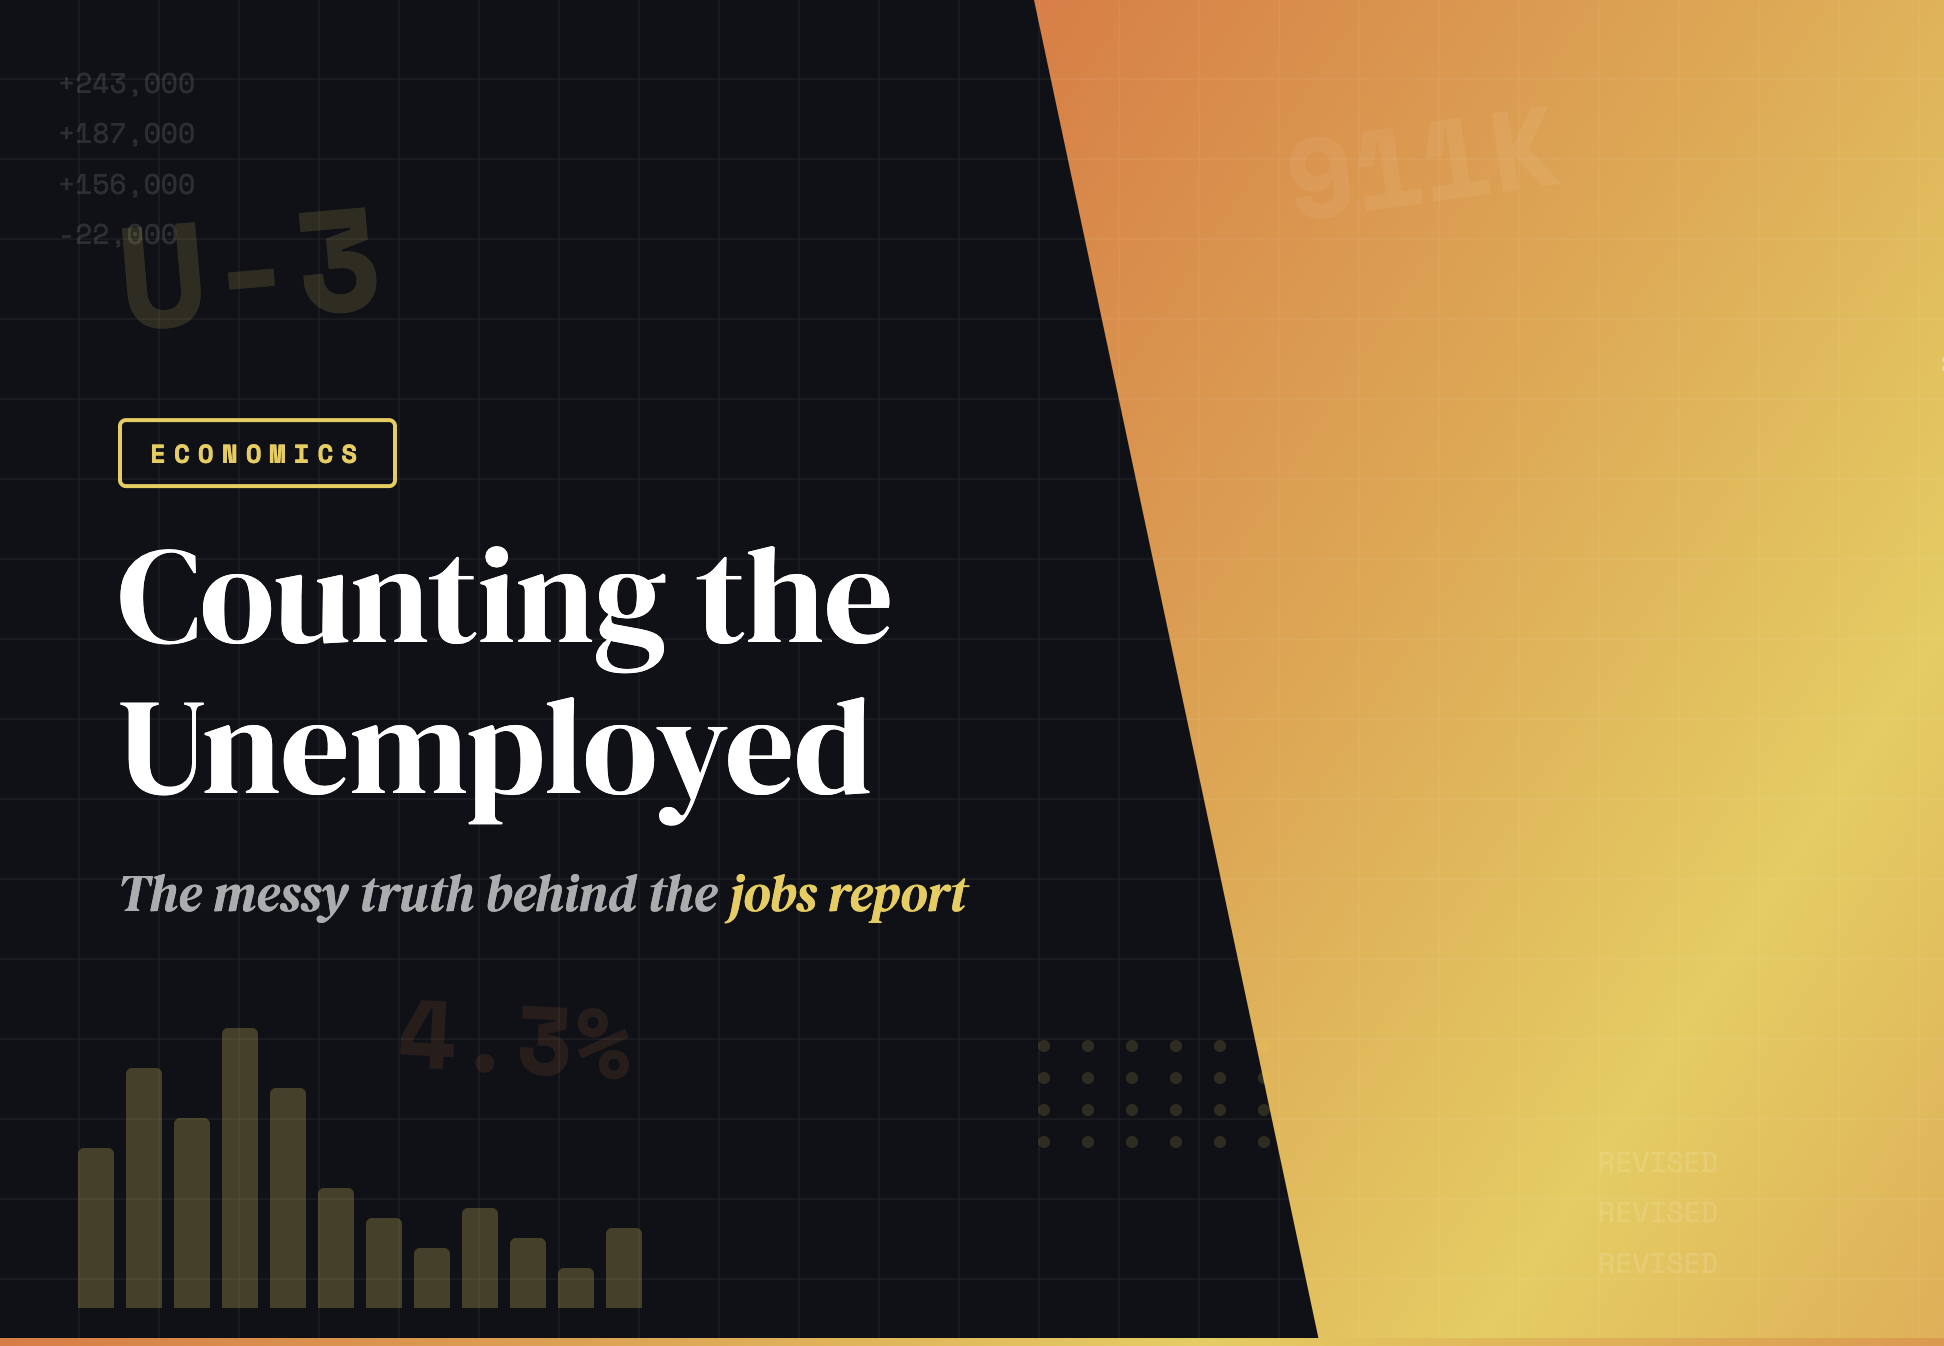
The BLS tries to address this by publishing six different measures of labor underutilization, labeled U-1 through U-6. The headline rate is U-3. The broadest measure, U-6, adds discouraged workers, marginally attached workers, and people stuck in part-time jobs who want full-time work. U-6 is typically several percentage points higher than U-3, but it rarely makes the news. Then there are the blind spots that no measure fully captures: gig workers cobbling together app-based income, freelancers between contracts, and people working part-time across three jobs. The categories were built for a world of stable, full-time employment. While the economy moved on, the measurement tools haven't entirely kept up.
Come back tomorrow for Part 2 of this topic!