FRED 101: The Free Data Tool That Runs Wall Street - Part 1
Written by Arbitrage • 2026-05-26 00:00:00
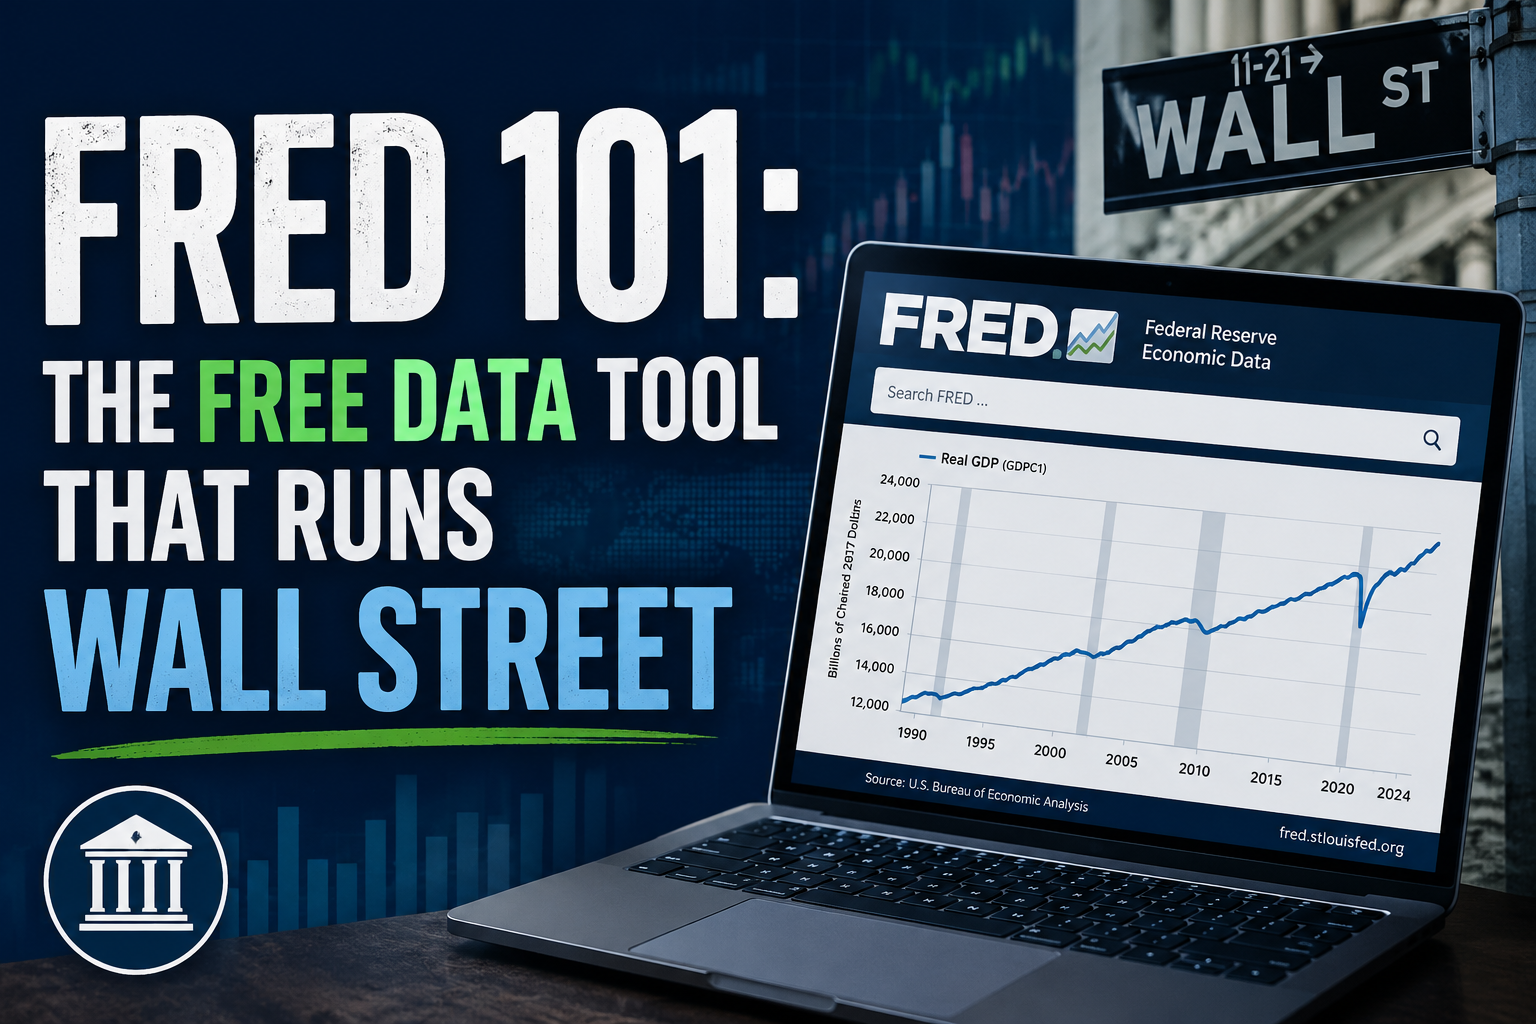
Here's a fun bit of irony. A free government website, built and maintained by a regional Federal Reserve bank, quietly powers more macro analysis than most of the paid platforms charging four figures a month. Hedge funds use it. Central banks use it. Sell-side strategists use it. The economists you see quoted in the Financial Times use it. And anyone with an internet connection can pull the exact same data, in the exact same format, for nothing.
It's called FRED, and it sits at the foundation of how serious traders think about the macro picture. More than 800,000 data series. Over a hundred source agencies. Decades of history on everything from inflation to industrial production to the spread between high yield credit and treasuries. If you're trading anything that touches the real economy, you should know it inside out.
Here's what FRED is, what's actually on it, and how to fit it into a trading workflow.
What FRED Actually Is
FRED stands for Federal Reserve Economic Data. It's run by the research division of the Federal Reserve Bank of St. Louis and has been around since the early 1990s. What started as a small collection of US monetary data has grown into the most comprehensive free economic database on the internet.
The platform aggregates data from more than a hundred sources. Some of the big ones include the Bureau of Labor Statistics, the Bureau of Economic Analysis, the Treasury, the Census Bureau, the OECD, the World Bank, and the Federal Reserve itself. Rather than visiting six different government websites to piece together a picture, you can pull it all from one place, in one format, with one interface.
You don't need an account to view charts or download data. Power users can register for a free API key and pull series directly into Python, R, Excel, or whatever else they're using. There's also a mobile app and integration with most major data tools.
The Data That Moves Markets
Before getting into the obscure stuff, here are the core series every macro trader should be able to find without thinking.
Growth
- GDP and the underlying components: consumption, investment, government spending, and net exports. The headline number gets the attention, but the composition tells you what's actually happening in the economy.
- Industrial production. A cleaner read on the manufacturing side than GDP, and it comes out monthly rather than quarterly.
- Retail sales. Real-time pulse on consumer behavior, which drives roughly two thirds of US GDP.
Inflation
- CPI and Core CPI. The headline inflation measure and the one that strips out food and energy.
- PCE and Core PCE. The Fed's preferred inflation gauge, calculated differently from CPI and usually slightly lower.
- PPI. Producer prices, useful as a leading indicator for CPI when input costs are moving.
Labor
- Unemployment rate. The headline read on the labor market.
- Non-Farm Payrolls. Monthly change in jobs, one of the most market-moving data releases on the calendar.
- JOLTS data. Job openings, hires, and quits. The quits rate in particular is a sharp read on labor market tightness.
- Initial jobless claims. Weekly, which makes it one of the few real-time labor series available.
Rates and Money
- Fed Funds Rate. The policy rate that anchors the entire short end of the curve.
- Treasury yields across the curve. Two-year, ten-year, thirty-year. FRED has them all, daily.
- M2 money supply. Aggregate money in the system, useful for cycle analysis.
- Bank reserves and RRP balances. The plumbing of the financial system and a window into Fed balance sheet dynamics.
The Hidden Gems
The series above are well known. The real edge sits in the data points that show up in serious macro theses long before the headlines catch up.
Stress Indicators
- St. Louis Fed Financial Stress Index (STLFSI). A composite of eighteen weekly data points designed to capture broad financial stress in a single number. When it spikes, something is breaking.
- Chicago Fed National Financial Conditions Index (NFCI). A broader, more risk-focused conditions index that captures credit, leverage, and risk appetite.
- ICE BofA High Yield Option-Adjusted Spread. The spread between junk bonds and treasuries. One of the cleanest reads on credit market stress available, and it's free.
Yield Curve Spreads
- 10-Year minus 2-Year Treasury Spread. The classic recession indicator. Inversions don't time anything, but they show up before every US recession in the modern era.
- 10-Year minus 3-Month Spread. The Fed's preferred yield curve measure, used in the New York Fed's recession probability model.
Forward-Looking Reads
- Initial jobless claims. Already mentioned, but worth saying again. It's weekly, it leads payrolls, and it's free.
- Commercial and industrial loans. Bank lending to businesses. When it rolls over, the real economy usually follows.
- Consumer credit. Tracks borrowing patterns, which lead consumption.
- Building permits. A genuine leading indicator for housing and broader cyclical activity.
These are the kinds of series that build context. Not signals on their own, but pieces of a picture that develops over weeks and months.
Come back tomorrow for Part 2 of this topic!