FRED 101: The Free Data Tool That Runs Wall Street - Part 2
Written by Arbitrage • 2026-05-27 00:00:00
If you have not read yesterday's blog post yet, please do so before continuing here.
How to Actually Use FRED
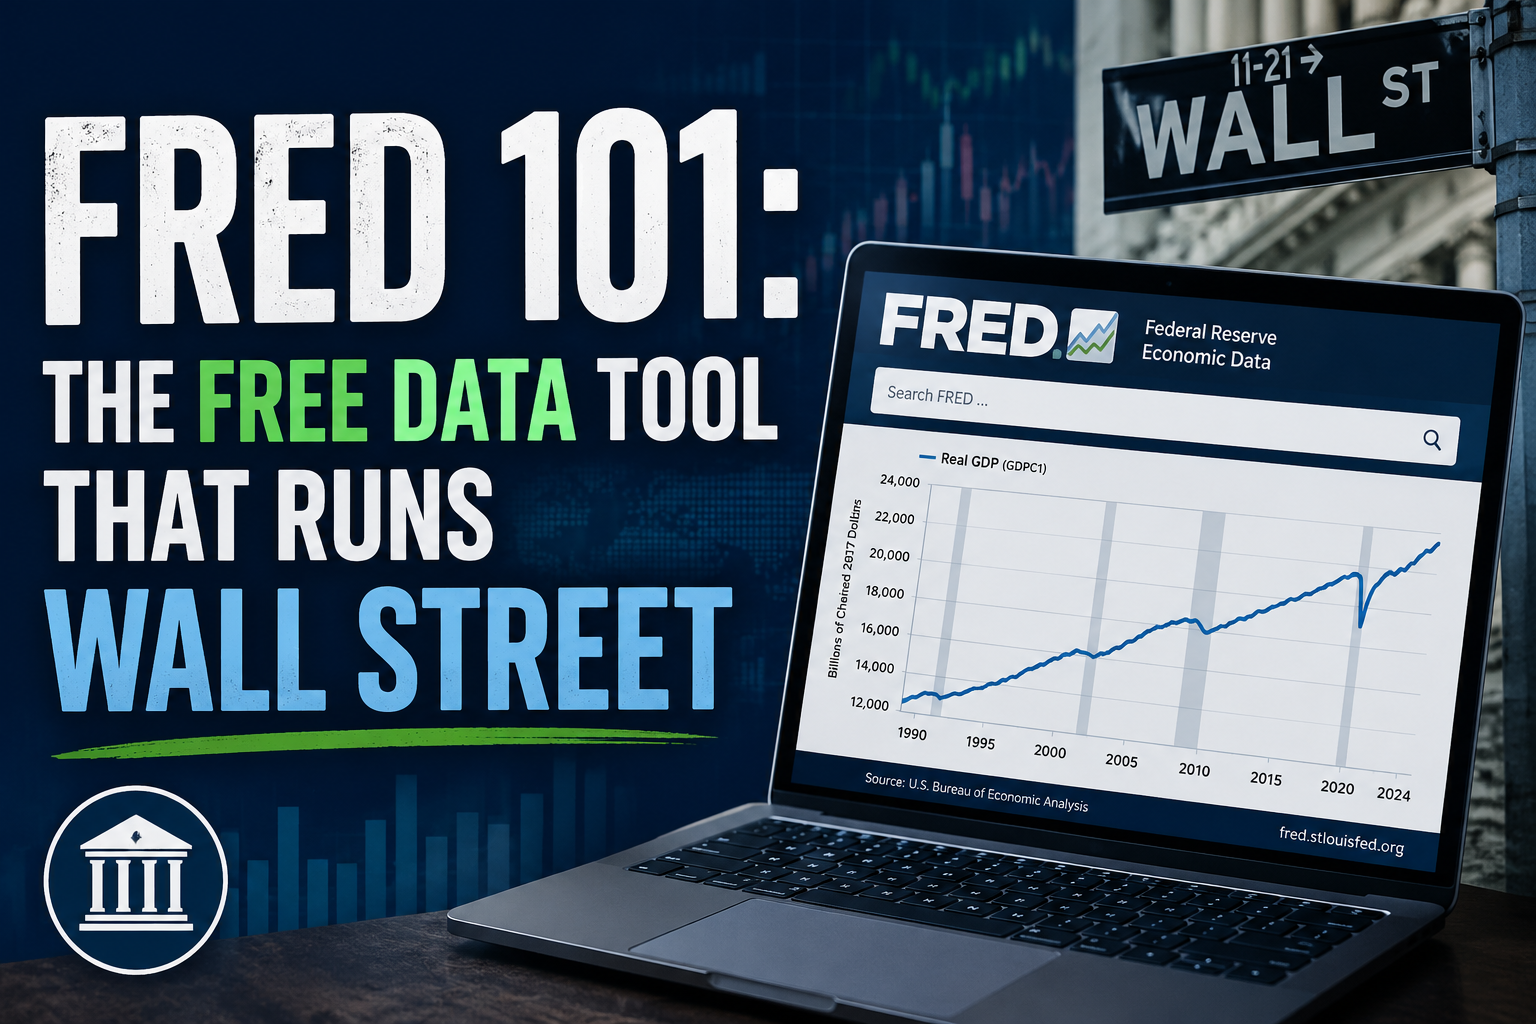
The interface is simple, which is part of why it has lasted thirty years without major redesign. Search a series name, pull up a chart, and you're looking at decades of history in a few seconds.
The Chart Tools
Every series has a built-in chart with a few features that matter.
- Transformations. Switch between levels, year-over-year change, quarter-over-quarter annualized, percent change, log scale, and a dozen others. This is where most of the analytical value sits.
- Recession shading. NBER recessions are shaded automatically on every chart. Useful for visualizing how a series behaves across cycles.
- Multi-series overlay. Plot multiple series on the same chart, with optional second axis. The Fed Funds Rate against the 10-Year, or Core PCE against M2 growth, in a few clicks.
- Date range. Zoom in on the last six months or pull up the full history back to the 1940s for some series.
Downloads and the API
Every series can be downloaded as a CSV or Excel file. For anyone building dashboards, the FRED API is genuinely excellent. The Python client is clean, rate limits are generous for free accounts, and the data structure is consistent across series. If you're building any kind of macro monitoring tool, FRED is the data backbone you start with.
Where FRED Fits in a Trader's Workflow
Free data doesn't make a trader. What it does is build the foundation that proprietary work sits on top of.
- Macro Context Before the Open: Pull up a watchlist of ten or fifteen series before you start the day. Yield curve, credit spreads, financial stress, key inflation prints if there's a release. Two minutes of context that frames everything else.
- Thesis Validation: When you build a view, FRED is where you stress test it against history. Patterns in the data across multiple cycles tell you whether your read fits the historical record or whether you're forcing a story.
- Custom Indicators: Raw series can be combined, transformed, and ratioed into custom indicators that fit your framework. The relationships between series often tell you more than any single data point. Real yields against the dollar. Credit spreads against equity volatility. Money supply growth against commodities.
- Fed Policy Tracking: Bank reserves, RRP balances, Treasury issuance, balance sheet composition. All on FRED, all updated, all free. For anyone trading rates or anything sensitive to Fed liquidity dynamics, this is the data that matters.
- Cycle Recognition: Decades of history across hundreds of series gives you the ability to study how the economy behaves across cycles. Patterns tend to rhyme, and FRED is where you find the rhymes. Treat it as the historical reference library that every other piece of analysis gets cross checked against.
The Limits of FRED
As good as FRED is, it isn't a complete solution. A few things worth knowing.
- Most data is lagged. CPI comes out monthly with a two to three week delay. GDP is quarterly. Real-time intraday data isn't what FRED is built for.
- Revisions are normal. GDP gets revised. Payrolls get revised, sometimes substantially. The first print is rarely the final number, and FRED reflects the latest vintage rather than the original release.
- It doesn't replace price action. FRED tells you about the underlying economy. Markets price the economy plus expectations plus positioning plus liquidity. Macro context is one input, not the whole picture.
- Free doesn't mean fast. If you need millisecond data feeds for execution, you're in the wrong place. FRED is built for analysis, not trading infrastructure.
None of this makes FRED less useful. It just means you use it for what it's built for and pair it with the rest of your stack.
Closing Thoughts
FRED is a starting point, not a finish line. The traders who win aren't the ones with access to data nobody else has. They're the ones who take widely available data and apply a framework most people don't have the patience to build. Macro context plus pattern recognition plus disciplined execution. That's the loop. FRED handles the first part for free, which means you can spend your energy on the parts that actually create the edge.
If you're not already using it, open it up. Pick five series that matter for whatever you're trading and put them on your dashboard. The rest tends to follow.