The Midterm Year Pattern: What the Election Cycle Says About Stocks, and Why the Dollar Won't Play Along - Part 2
Written by Arbitrage • 2026-07-15 00:00:00
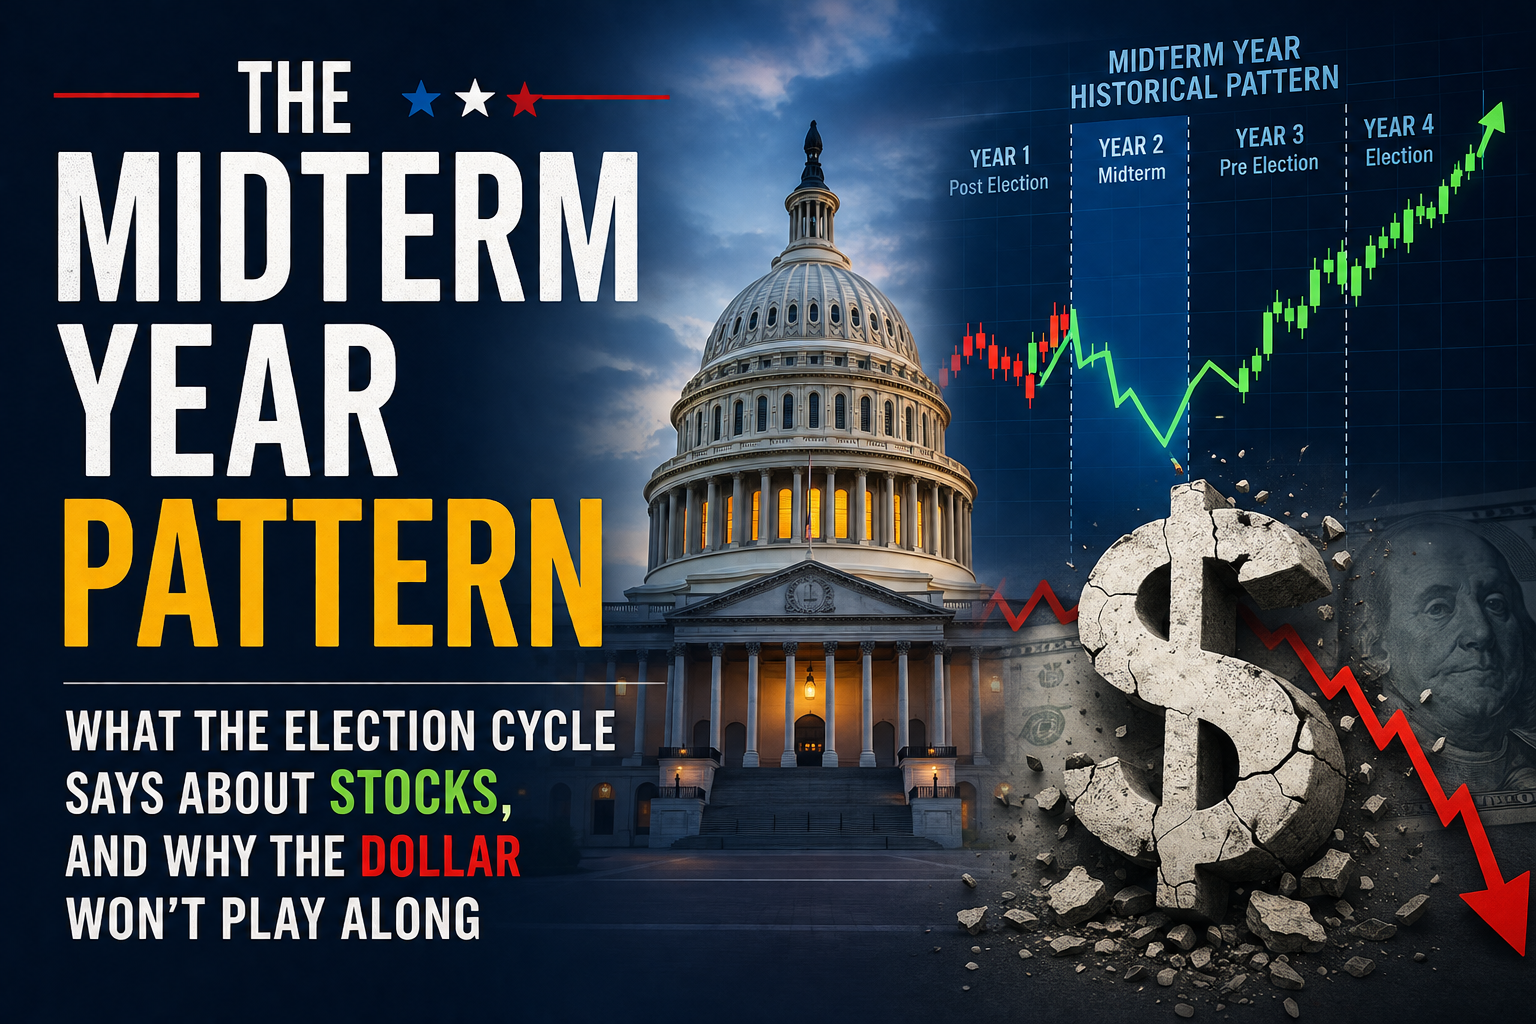
If you haven't read yesterday's blog post yet, please do so before continuing here.
The caveat that matters
2018 is the reminder to hold all of this loosely. That midterm year rallied through the middle of the year, then dropped more than 13% in the fourth quarter and closed down around 6%, as Fed policy and trade headlines took the wheel. Seasonals describe tendencies across a sample, not a script for any single year. The averages here are built on a few dozen observations, and one macro shock can override the calendar entirely. The pattern raises the odds of a particular shape. It doesn't lock it in.
The dollar doesn't read from the same page
This is where a lot of cycle commentary overreaches. The dollar doesn't carry a midterm seasonal anywhere near as clean as equities do. What actually moves it, rate differentials, growth differentials, the Fed's path, trade and capital flows, mostly sits outside the election calendar. The closest thing to a cross-cycle currency pattern in the research is party-based rather than year-based. One study in the Review of Financial Economics found Republican terms have tended to open with a strong dollar that fades over the term, and Democratic terms the reverse. Even that's a small-sample tendency with no clean causal story, and the authors say as much.
What you do tend to see around elections is volatility, not direction. Currencies can get jumpy as policy expectations reprice into a vote. The dollar rose about 7% in the three months into the 2016 election on fiscal-stimulus expectations, for example. But that's positioning around a specific catalyst, not a reliable calendar edge you can set your watch by.
2026 as a live test
Put the two together and this year makes a decent case study. On the equity side, the market's broadly tracked the seasonal shape so far, choppy and range-bound through the first half with the usual midterm nerves showing up in the volatility. The dollar's the more interesting tension. Structurally it's been under pressure, down roughly 10% in 2025 and touching four-year lows early in 2026 on twin-deficit concerns and an expected Fed easing path. Cyclically, it's found support, because the energy-driven inflation spike this spring pushed CPI back above 4% and took the Fed's rate cuts off the table, even turning the conversation toward a possible hike. As of early July the index is hovering around 100, caught between the structural weak-dollar case and higher-for-longer rate support. That's a rates-and-inflation story, not a seasonal one, which is exactly the point about the dollar.
How to actually use it
The honest version is that the midterm equity pattern is context, not a signal. It suggests the probabilities have historically favored weakness into the back half and a recovery setup off the low, and it flags the second half of the year and the turn into the pre-election window as stretches to watch more closely. It doesn't tell you what to do on any given day, and it reads best layered underneath your own view of price and momentum rather than standing on its own. The dollar deserves the opposite treatment. Don't force it into the cycle at all. Let rate differentials and the Fed do the explaining, and treat any election-year moves as volatility around catalysts rather than a calendar edge.
Patterns like this earn their keep as a lens, not a forecast. The years that respect the seasonal and the years that ignore it tend to start out looking exactly the same, which is the whole reason to know where you are in the cycle before the tape makes it obvious.
This content is provided by Arbitrage Trade for informational and educational purposes only. It's market analysis and pattern recognition, not investment advice, and nothing here is a recommendation to buy, sell, or hold any security. All examples are illustrative. Historical patterns and averages describe past tendencies across a sample of observations and don't predict or guarantee future results. Any figures referenced are approximate and drawn from third-party historical data. Do your own research and consult a licensed professional before making financial decisions.